Compare two polars, complete and export them
Overlay two speed polars (library of 510 references, .pol files or your polars), adjust them right on the diagram, fill in missing cells, read the automatic analysis and export to .pol.
The essentials
The comparison tool puts two polars side by side: A is the baseline, B is compared with A. It is open to everyone, with or without an account, and nothing is saved.
- Open Polar Compare in the menu (without an account), or Polars then Compare polars (with an account).
- For polar A then polar B, choose a source: Library (more than 510 reference polars), File (
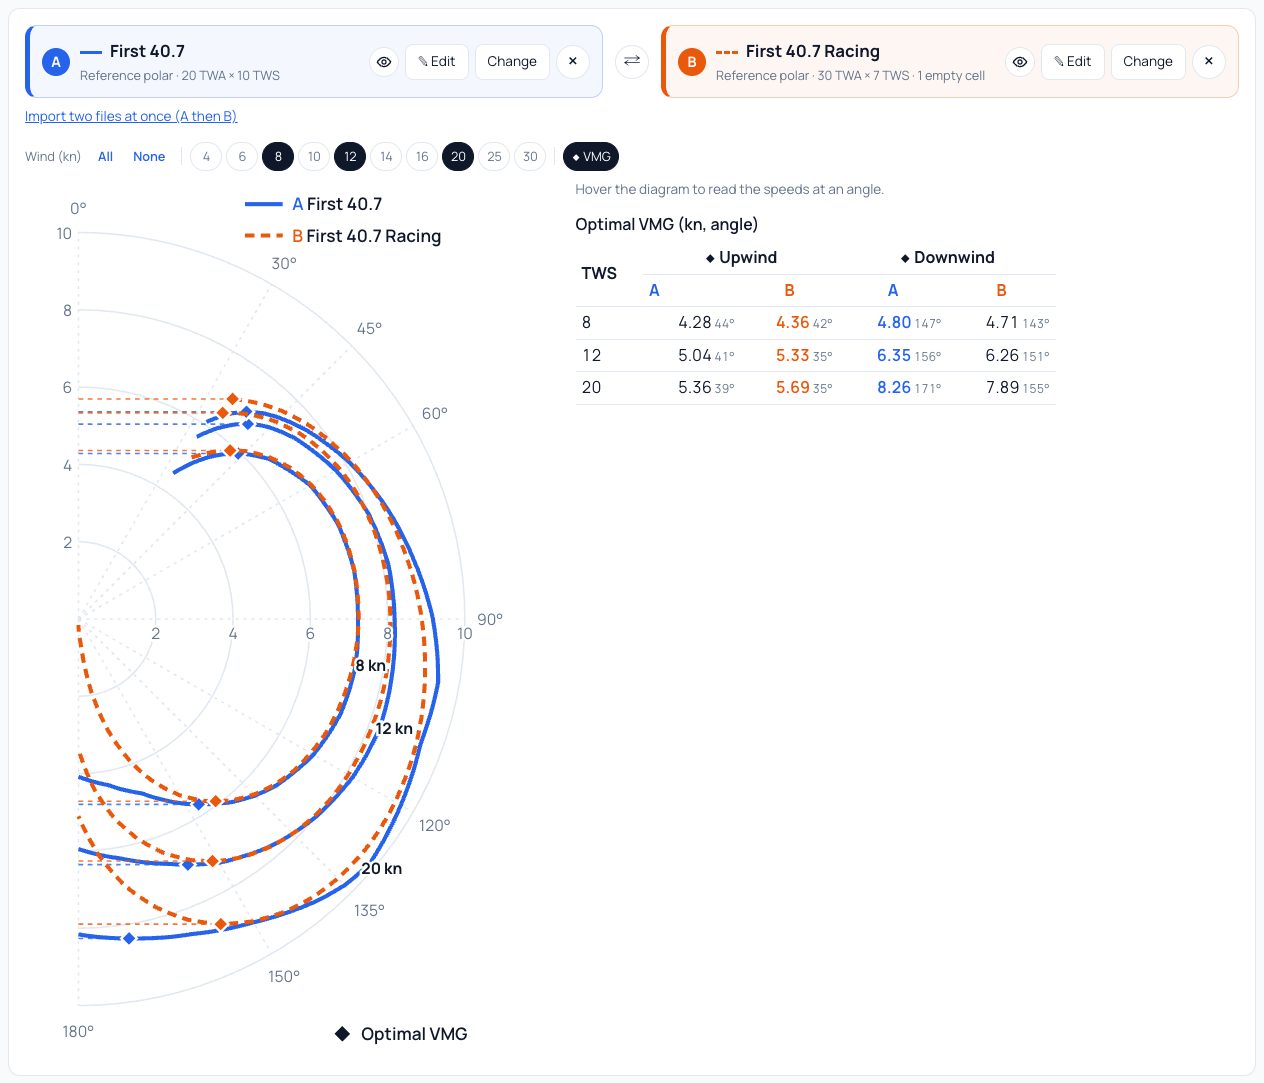
.pol,.txtor.csv), My polars (with an account) or Generated polar (the one computed from your logs during the visit). The Import two files at once (A then B) link loads both in one go. - The diagram overlays both polars: A as a solid blue line, B as a dashed orange line. Choose the wind speeds shown (All, None or one by one) and hover the diagram to read the speeds.
- To adjust a polar, click Edit on its panel and drag its points on the diagram, then Export .pol or Export .csv.
- Further down, the Tables give the cell-by-cell gaps and each polar as an editable table; the Analysis wraps up: overall verdict, gaps by wind strength and by point of sail, optimal VMG, largest gaps.
Going further
Reading the diagram
- Wind (kn): All shows every wind speed of both polars, None removes them all; then click a wind speed to add or remove it. Hovering a wind speed (button or row of the readout table) brings its two curves forward.
- The eye on each panel hides or shows its polar on the diagram.
- Boat speeds (in knots) are graduated on the vertical axis and repeated on the 90° axis, so you can read a curve’s speed directly.
- VMG (on by default): for each wind speed shown and each polar, a diamond marks the optimal VMG upwind and downwind (its dotted line runs to the wind axis: the further up or down from the centre, the better the VMG). On the right, the Optimal VMG table gives the values and angles; the better of the two polars takes its colour.
- Hover the diagram: on the right, A’s speed, B’s speed and the gap for each wind speed shown, at the angle pointed at.
- The figure at the top of each pair of curves is the wind speed.
Editing a polar on the diagram
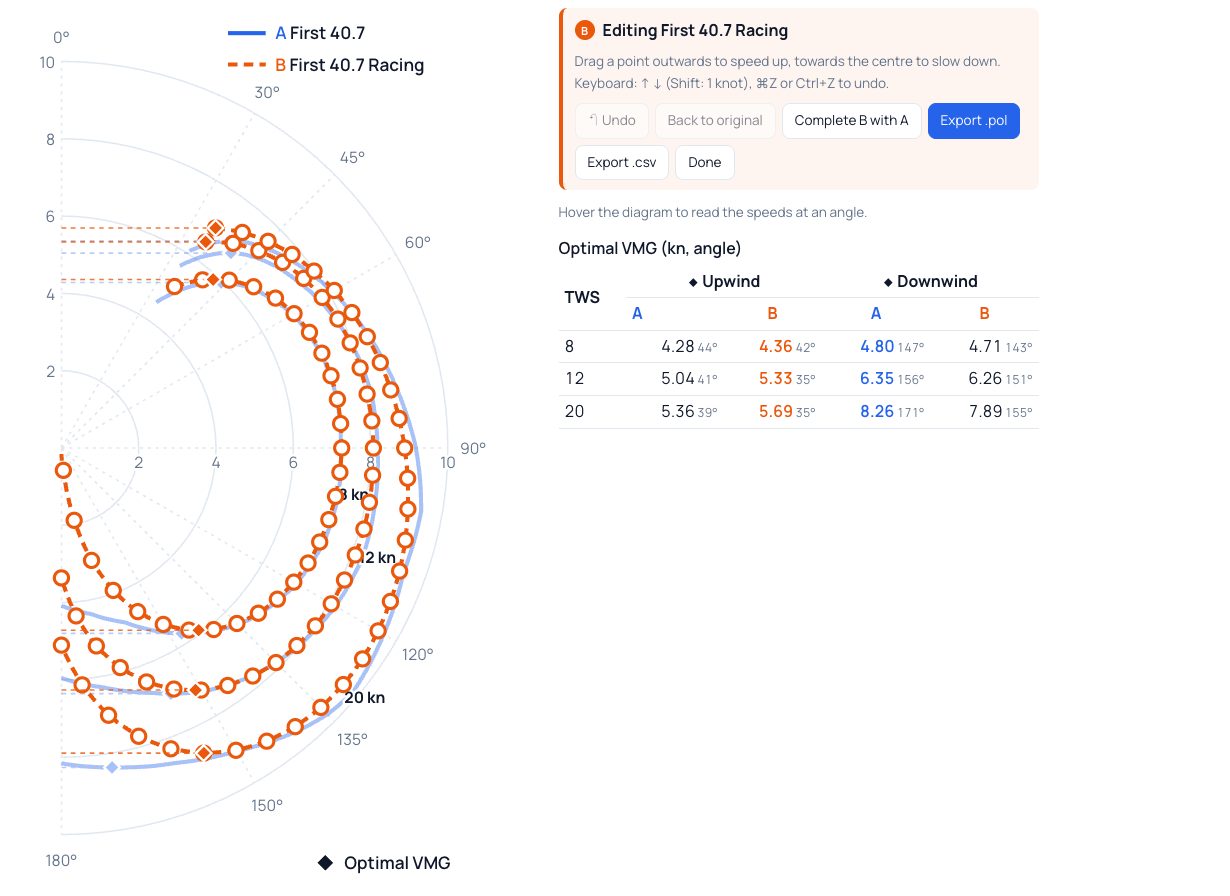
Click Edit on A’s or B’s panel. Each cell of its grid becomes a point, for the wind speeds shown; the other polar fades into the background.
- Drag a point outwards to speed up, towards the centre to slow down (in 0.1-knot steps). The readout shows the new value and the original one.
- With the keyboard: Tab moves from point to point, ↑ and ↓ change the speed by 0.1 knot, Shift + arrow by 1 knot.
- Undo (or ⌘Z / Ctrl+Z) reverts the last edit, Back to original reloads the polar as it was chosen, Done leaves edit mode.
- An empty cell has no point: complete the polar first (see below).
The analysis and the tables follow every edit.
Tables
The Gaps tab covers the common grid (every angle and wind speed of both polars), in % or in knots, tinted with the colour of the faster polar. An italic cell holds at least one interpolated value (missing from the file, computed between neighbouring cells). A cell marked · has no value in one of the two polars.
The A and B tabs show each polar in the same table as the polar editor: click a cell to change it, add or remove an angle or a wind speed, apply an overall factor in %.
Reading the analysis
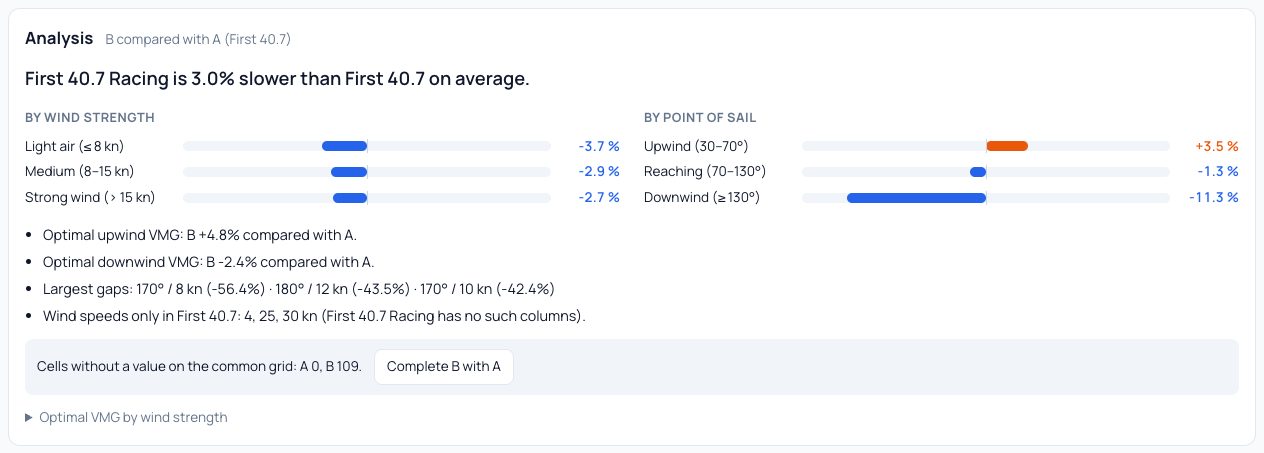
Every gap is B compared with A, as a percentage of A’s speed: +5% means B is 5% faster than A in those conditions. Cells in the no-go zone (under 30°) and speeds under 1 knot are left out, as a percentage gap makes no sense there.
- By wind strength: light air (up to 8 knots), medium (8 to 15 knots), strong wind (above 15 knots).
- By point of sail: upwind (30 to 70°), reaching (70 to 130°), downwind (130° and more).
- Optimal VMG upwind and downwind: best velocity made good towards or away from the wind, compared for each common wind speed; the detail (VMG and optimal angle of A and B) opens under Optimal VMG by wind strength.
- When the lead changes hands between light air and strong wind, the analysis says so.
- Wind speeds present in only one of the two polars are listed.
Bars and figures take the colour of the faster polar: blue for A, orange for B.
Filling in missing wind speeds and angles
Two polars rarely share the same grid. Complete A with B (or B with A) fills the empty cells of the common grid:
- within the range covered by the polar, by interpolating between its own values;
- beyond it (a wind speed or angle it does not cover), with the other polar’s value scaled to yours, based on the gap measured at the nearest common point.
Existing values are never changed. Undo steps back, Back to original reloads the polar as it was chosen.
Exporting
The export buttons are in the diagram’s edit panel and in the A and B tabs of the tables. Export .pol writes a text file in the format read by most routing software (TWA\TWS header, one line per angle, tabs); Export .csv writes the same table separated by semicolons. An empty cell is written as 0, the .pol convention: complete the polar before exporting if you want a full grid.
Sharing a comparison
When A and B come from the library, the page address holds their names: copy it to come back to or share the same comparison. With an account, Compare in the Actions menu of one of your polars opens the comparison tool with that polar as A.
Frequently asked questions
Do I need an account?
No. Without an account, you compare library polars, your files and the polar generated from your trial logs. An account adds My polars.
Why do zeros from my file show as empty cells?
In .pol files, a 0 outside the no-go zone means “no value”. The comparison tool treats it that way so as not to skew the analysis, and completion can replace it with a real speed.
Are my edits saved?
No: they stay in the page until you export. To keep a polar in your account, import the exported file.