Analyse a session: map, timeline and replay
Open a session in Avelsta, read the track on the map, hover over the timeline, start the replay, zoom, compare with the polar and read the instant values.
The essentials
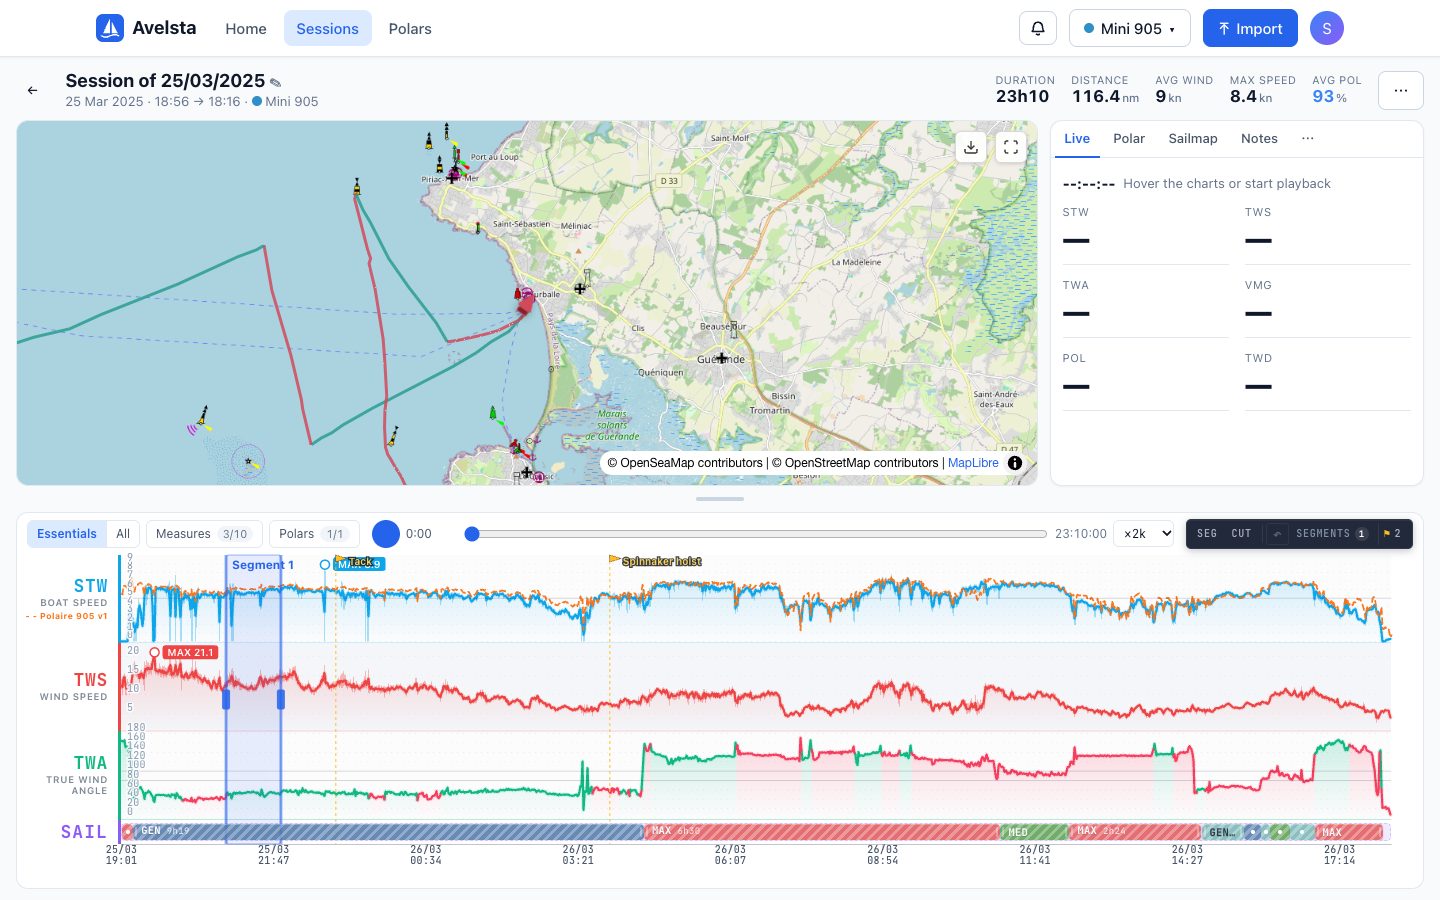
A session page brings together the map, the curves and the instant values, all in sync.
- Open a session from Sessions or the home screen.
- Read the header: duration, distance, average wind, max speed and average POL (polar percentage).
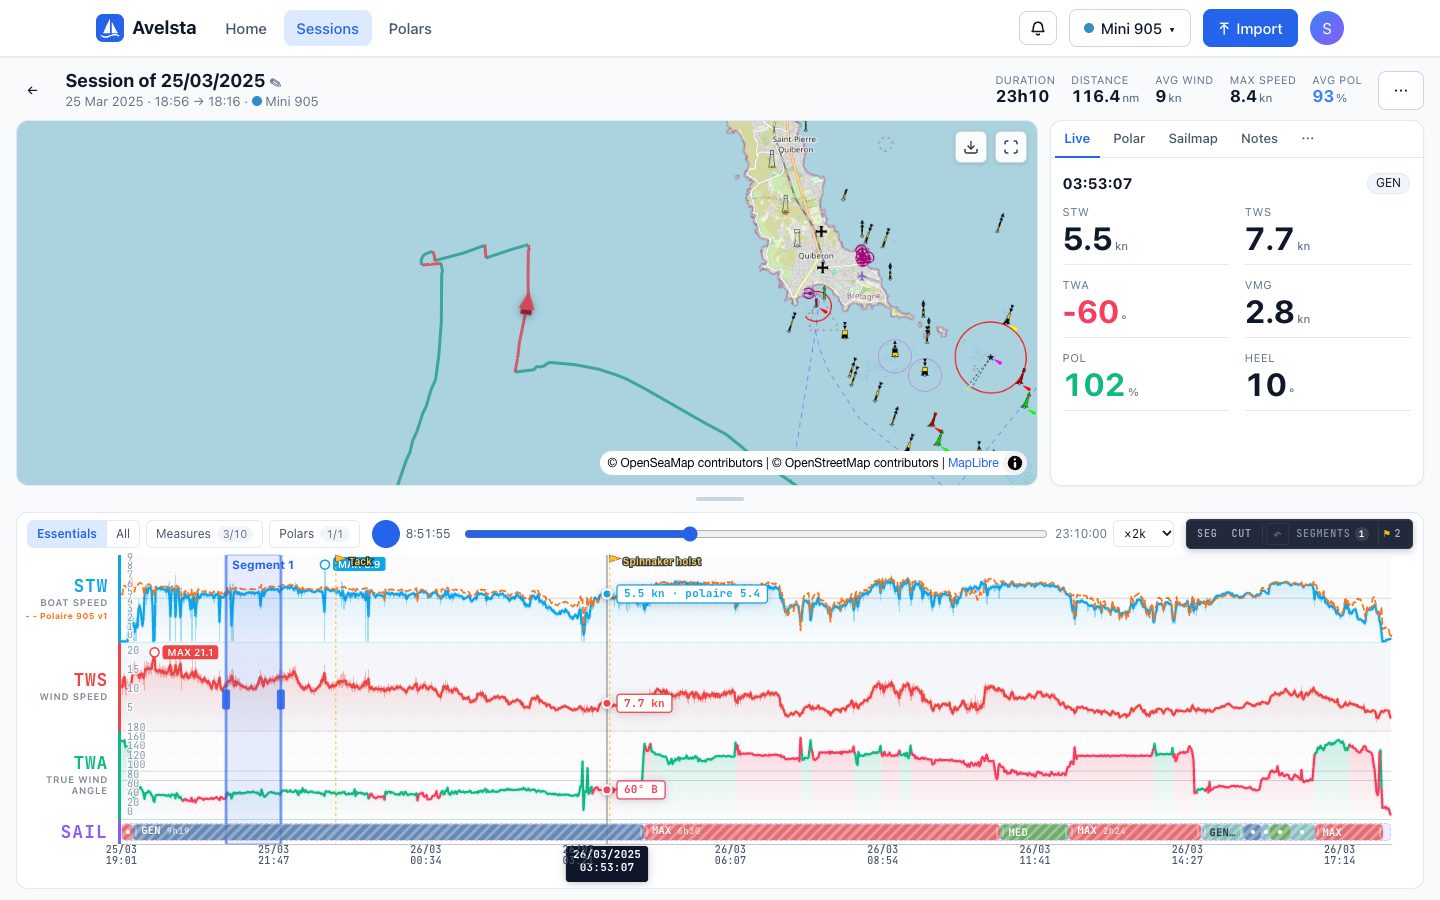
- Hover over the timeline: the boat moves on the map and the Live tab shows the values at that moment.
- Click the play button (or press Space) to start the replay; choose its speed (×1 to ×20k).
- Scroll the mouse wheel on the timeline to zoom, drag to pan.
Going further
The map
The track is coloured by tack: red for port, green for starboard. The OpenSeaMap layer shows buoyage and hazards. Two buttons at the top right: export the track as GPX and full screen. The handle between the map and the curves can be dragged to enlarge one or the other; a double-click resets the split.
The timeline
Each row is a measure (boat speed, true wind, angle…), all aligned on the same time axis. The dashes on the boat speed show the polar’s target speed at the same angle and wind. Each measure in detail: Timeline measures.
| Control | Effect |
|---|---|
| Essentials / All | Speed, wind and angle only, or every measure available |
| Measures | Choose the rows shown |
| Polars | Choose the polar(s) compared with the boat speed |
| Play, slider, ×1 … ×20k | Replay and playback speed |
| SEG | Select a range to create a segment |
| CUT | Select a range to exclude |
| ↶ | Undo the last exclusion |
| Mouse wheel, drag | Zoom, pan; the ×n button resets the zoom |
| Double-click | Add a checkpoint |
| SAIL row | Sail configurations carried: see Sail configurations on a session |
The tabs
| Tab | Content |
|---|---|
| Live | Values at the hovered moment: STW or SOG, TWS, TWA, VMG, POL, heel (or TWD without a heel sensor), sail configuration carried |
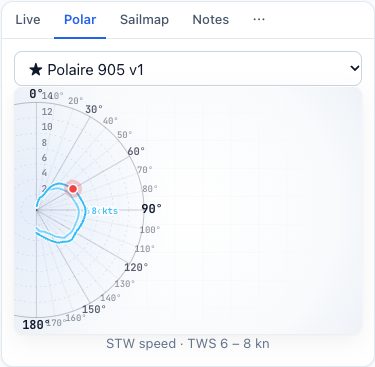
| Polar | The applied polar, with the boat’s position at that moment; click for full screen |
| Sailmap | The boat’s sailmap and the session points; see The sailmap |
| Notes | The session description |
| Segments, Checkpoints | The ranges and marks added on the timeline |
| Source | The session’s log files, ready to download |
The “⋯” menu
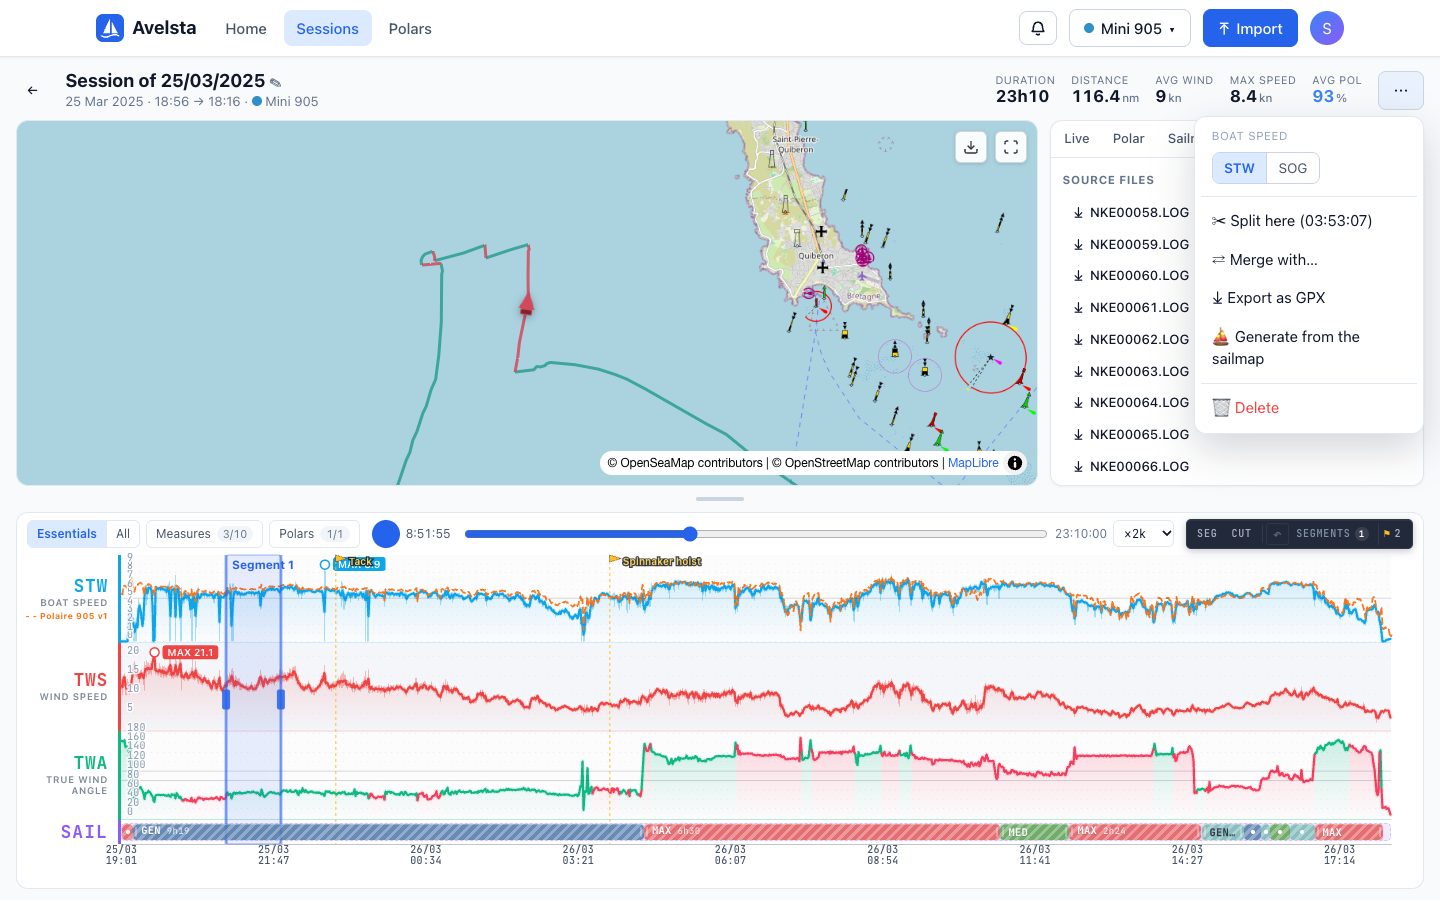
At the top right, the session menu lets you choose the reference boat speed (STW through water or SOG over ground), split the session at the cursor, merge it with another one, export it as GPX, generate the sail configurations from the sailmap and delete it.
Rename and describe
Click the session name to change it. The Notes tab holds a free description (conditions, crew, trim settings).
Frequently asked questions
STW or SOG: which speed should I choose?
STW (speed through water, measured by the log) is the reference for performance: it ignores the current. SOG (speed over ground, GPS) includes the current; use it if the log is missing or poorly calibrated.
The replay is too slow or too fast
Change the playback speed in the menu next to the slider: ×1 (real time), ×20, ×200, ×2k, ×10k or ×20k.