The sailmap: which sails for which wind
Build your sailboat’s sailmap in Avelsta: angle × wind speed grid, sail configuration per cell, painting tools, observed layer from your sessions, import and export to a spreadsheet.
The essentials
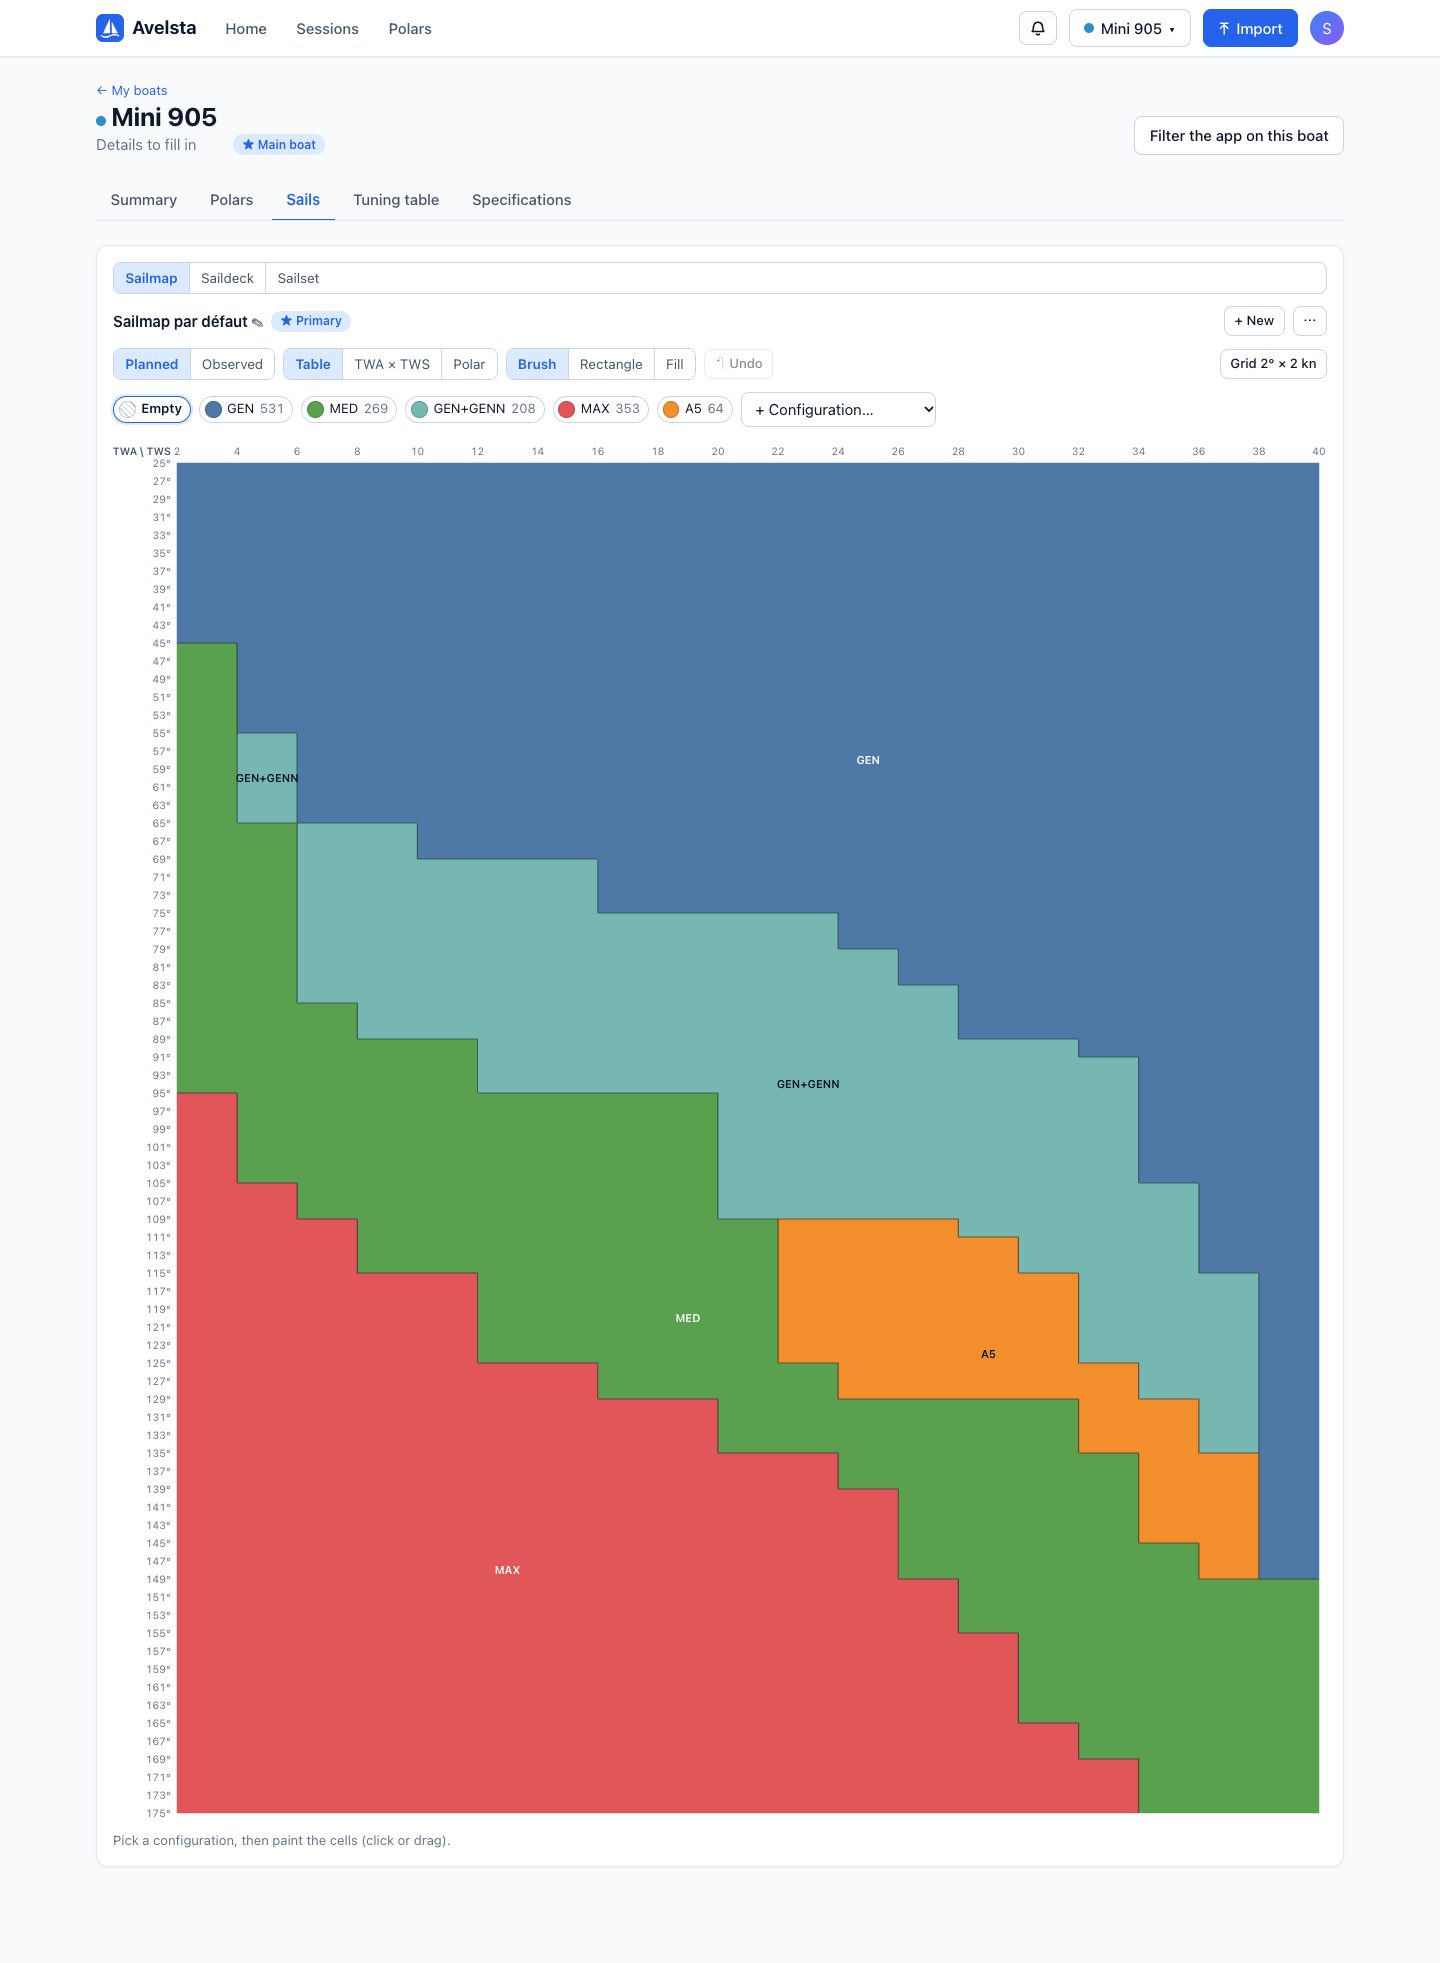
The sailmap (or crossover chart) gives, for each true wind angle (TWA) and each true wind speed (TWS), the sail configuration to carry.
- Open the boat sheet, Sails tab, Sailmap view.
- Choose a configuration in the legend (or + Configuration…), then the Brush, Rectangle or Fill tool.
- Paint the cells: click or drag. Undo (Ctrl Z / ⌘ Z) steps back.
- Switch to the Observed layer to see what you actually carried while sailing, and adjust.
Going further
Three views
| View | Use |
|---|---|
| Table | One row per angle, one column per wind speed; the most precise to paint |
| TWA × TWS | The same grid as a chart, with the points of your sessions |
| Polar | The sailmap in polar coordinates, like a polar diagram |
The grid
The grid button (for example “Grid 2° × 2 kn”) sets the bounds and step of the angles (0 to 180°) and wind speeds (0 to 80 knots), with two presets, Fine and Coarse. When the grid changes, each new cell takes the configuration of the old cell that contains its centre.
Planned and observed
- Planned: the sailmap you draw, your plan.
- Observed: computed from the configurations recorded on your sessions. For each cell, Avelsta keeps either the most carried configuration or the one with the best POL %, with a minimum time per cell.
Fill the empty cells copies the observed layer into the cells still empty; Apply the differences replaces the cells where the observed layer differs from the plan. Both can be undone with Undo.
Several sailmaps
A boat can have several sailmaps (for example “Short-handed”, “Racing”). + New creates one; the ⋯ menu duplicates, exports or deletes it; the pencil next to its name renames it. The primary sailmap (★ Set as primary) is used to pre-fill the session configurations.
Exchanging with a spreadsheet
- Export to a spreadsheet: a TSV file that opens in Excel, Numbers or Google Sheets.
- Import from a spreadsheet: paste the copied cells, with a header row of wind speeds (2-6, 6-10…) and a first column of angles (50, 60…). Labels are matched to your configurations; those that match none are flagged.
On a session
A session’s Sailmap tab places the boat on the sailmap during the replay and shows the session points: see Sail configurations on a session.
Frequently asked questions
Do I need a sailmap to use Avelsta?
No. It helps plan and analyse sail choices; speed analysis and polars work without it.
There is no configuration in the legend
First create configurations in the Sailset view: each sailmap cell gets one. See Sails and configurations.